

Britain now has a digital heatmap. This shows the varying levels of digital competency across the country and according to age, gender and income. Because the map is based on a representative sample of face-to-face interviews, it is good impression of what people say they can do, and have recently done, using smartphones, tablets, computers and online resources. Overall, the heatmap demonstrates the value of investment in digital infrastructure.
This useful tool is the work of Go ON UK, in partnership with the BBC, the Local Government Association, Lloyds Banking Group and the London School of Economics. There are all sorts of implications in this data, from the provision of basic information, access to online banking and financial services, retailing and entertainment. There are also key implications for education. Whatever the mode of education provision, online resources and basic digital competencies are important. For countries lacking the comparative wealth and resources of the United Kingdom, there are pointers here to ways in which investments in infrastructure and basic digital competence can accelerate access to education, and improvements in provision.
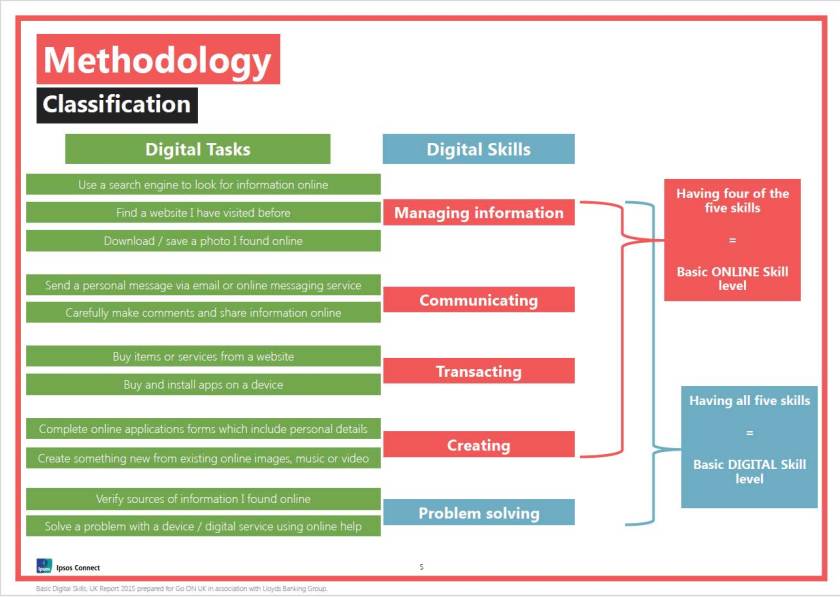
This is how the heatmap works. Using standard polling techniques, Ipsos MORI asked a sample of people to describe their competency across a set of basic digital tasks, clustered together as five digital skills: managing information, communicating, transacting, creating and problem solving. These are pretty close the long-established basics for information literacy, as generic outcomes for education.
These competencies were then mapped against the standard socioeconomic indicators produced by the Office for National Statistics, and information on regional variations in Internet availability.
There are, or course, limitations to the utility of this data. As Ellen Helsper from the London School of Economics points out,
The Heatmap suffers from legacy issues; the current map uses and adapts existing data and measures which do not reflect the latest thinking about the types of access, skills and usage which indicate inclusion in a Digital Britain. Researchers and policy makers urgently need to broaden their thinking about digital skills. There is too little knowledge about the basic digital skills needed to participate fully in everyday life. More work is needed to think systematically about which digital skills are necessary to achieve tangible beneficial social outcomes and avoid those which are potentially negative.
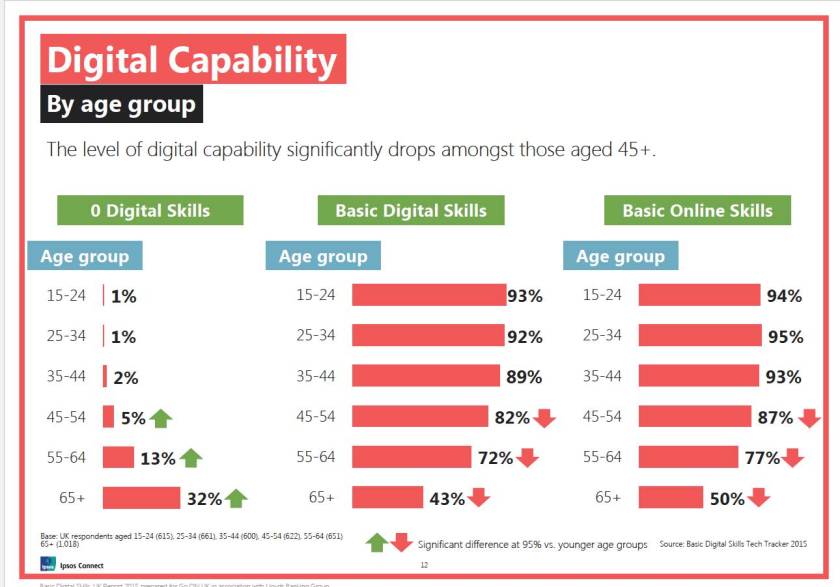
Despite this, the results are instructive. As expected, age is a factor, and just how much this counts is very clear from the survey results. 93% of all 15 to 24-year-olds have the full set of basic digital skills and only 1% has none. In comparison, for 55-64-year-olds, as the most senior age group that is mostly in employment, 13% still have no digital skills and only 72% have the full set. This comes with the near-saturation of access to smart digital devices; 82% of all adults in the United Kingdom now have a PC or a laptop in the home, and 71% have a smartphone. From an education perspective, digital is everywhere and young Britain is online.
Looking to educational outcomes and employment, the survey shows a clear relationship between digital literacy and earnings. Considered across the UK as a whole, there is a 30% difference in digital competence between those earning up to about £10 000 a year and those taking home more than £75 000 a year. Of course, a correlation is not a cause and effect relationship; it could well be that those earning more can better afford the personal tech needed to work and play online. None the less, it makes intuitive sense that employers will regard basic digital skills as part of the generic competences required for more skilled, and better remunerated, jobs.

Of particular interest, both in general and for the implications for education policies, is “digital exclusion” – the current manifestation of the longstanding concern with the digital divide. The digital heatmap – appropriately – is an interactive online tool that will help local authorities direct street-by-street interventions. Again not surprisingly, digital exclusion mirrors socioeconomic exclusion more generally, although there are still a lot of uncertainties in the data. Ellen Helsper again:
The Heatmap confirms strong links between social and digital inequalities in the UK and shows an island of inclusion around London and increasing levels of exclusion radiating out towards the North, West and East. Upon closer examination, the Heatmap also confronts us with the significant gaps in existing evidence relating to levels of basic digital skills and use and, therefore, highlights how our understanding of the social causes and consequences of digital inequalities may be limited. The data send a clear message: digital inclusion policy cannot stand on its own; it needs to be embedded within broader economic, social inclusion and well-being programmes and policy making.
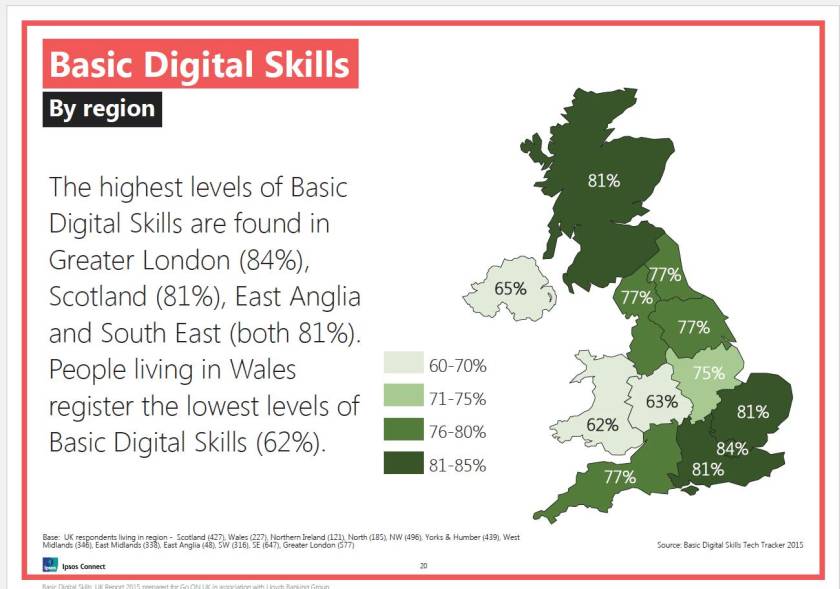
But despite these reservations, one stark disparity shines out from the map for the UK as a whole: the difference between Scotland and Wales. These are wonderful, mountainous and often-wild landscapes: the joy of holidaymakers; the despair of digital technicians and providers of microwave towers. But despite their topographic similarities, Scotland persistently comes out well, matching Greater London for basic digital skills, and Wales consistently scores low, with the lowest levels of digital skills in the country.
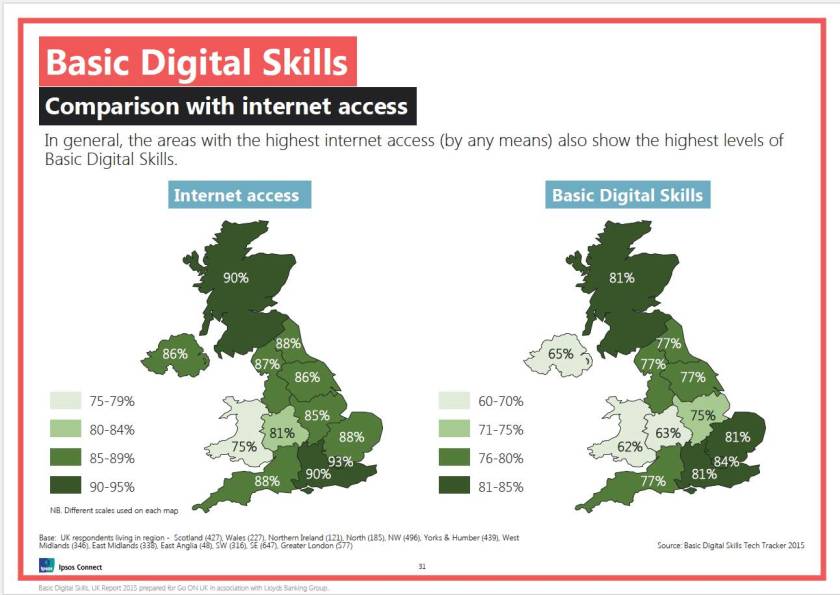
Although, surprisingly, Go ON UK’s report has little to say about this, there is an evident correlation with Internet availability. Online access in Scotland matches availability in London; Wales has the worst access in the United Kingdom.
The overriding message here seems clear; investment in digital infrastructure pays, and in all sorts of ways. For education, equitable access to digital infrastructure will be in the same order of importance as traditional, tangible, enabling resources; school buildings, libraries, playgrounds.
**
Ellen Helsper, “Measuring inequalities in a digital Britain”. LSE Media Policy Project Blog: http://blogs.lse.ac.uk/mediapolicyproject/2015/10/19/measuring-inequalities-in-a-digital-britain/
Digital Exclusion Heatmap: http://www.go-on.co.uk/resources/heatmap/
Go ON UK: Basic Digital Skills. UK Report 2015: https://goon-uk-prod.s3-eu-west-1.amazonaws.com/uploads/Basic%20Digital%20Skills_UK%20Report%202015_131015_FINAL.pdf?utm_source=about_heatmap_page&utm_medium=bds_research&utm_campaign=bds_research_about_heatmap_page

Thank you very much. What would the South African heatmap look like? Insight from the report supports the ICT Roll Out programme currently happening in Gauteng; this programme also urges educators nearing seniority to also engage in ICT. I believe a bit of this study can be quickly conducted in South African education through the South African School Administration and Management System (SA-SAMS) as it already contains functionality to start chipping away at the iceberg of such a study. The UNESCO Institute for Statistics is also conducting surveys to grade, per country, education’s use and investment in ICT’s. This is also valuable despite challenges around the internalization of the survey questions per country causing the results of the survey to have some limitations.